Building Whose Bet Cashes
- astro
- typescript
- side projects
Over the past few years I've been listening to a lot of sports talk podcasts, either when I'm walking somewhere or doing things around the house and I want something on in the background. Now if you haven't been doing the same or watching a lot of those shows or sporting events, you might not realize how prevalent sports betting content has become since the Supreme Court opened the door in 2018. I'm here to tell you that it's ubiquitous. In case you're not familiar, here are some examples of the betting language that you'll hear:
- "I'm taking the Seahawks plus three and a half." — Colin Cowherd, The Herd, Sept 2018 · lost
- "Give me the New York Giants with all the uncertainty." — Stuckey, Action Network, Nov 2023 · won
- "I'm hammering the Falcons minus three. I think this is a double digit win for them." — Chris Raybon, Action Network, Nov 2018 · lost
- "Hard Rock is plus one. Go get the one and a half. Get the hook." — Simon Hunter, Sharp or Square, Sept 2025 · won
- "So we've done it. It's happening. Atlanta's in. Lock it in. Lock it in." — Simon Hunter, The Favorites, Sept 2024 · lost
- "Wink wink game of the week from your final boss, North Texas plus four over Army." — Joe Fortenbaugh, UnSportsmanLike, Nov 2024 · lost
- "So we got the Nuggets on the money line, Jokic over 10 and a half rebounds." — Chris Canty, UnSportsmanLike, Jan 2024 · won
- "But I will sprinkle 150 to one offensive player of the year." — Brandon Anderson, Action Network, Oct 2024 · lost
- "I love Baltimore winning at least 11 games this year. I love it." — Nick Wright, What's Wright?, Sept 2022 · lost
- "Over on the 30 and a half point total. Don't ask me how the two teams are gonna cobble together 31 points or more. I don't know." — Chris Canty, UnSportsmanLike, Dec 2023 · won
Given how much I was bombarded with betting content, my interest in placing my own bets was piqued. It always sounds as if there's "easy" money to be made. At the same time, there was no place to go to see how good these hosts and guests actually were at picking winners. Eventually I decided to build a site that tracks how bettors do and that's how whosebetcashes.com came into being.
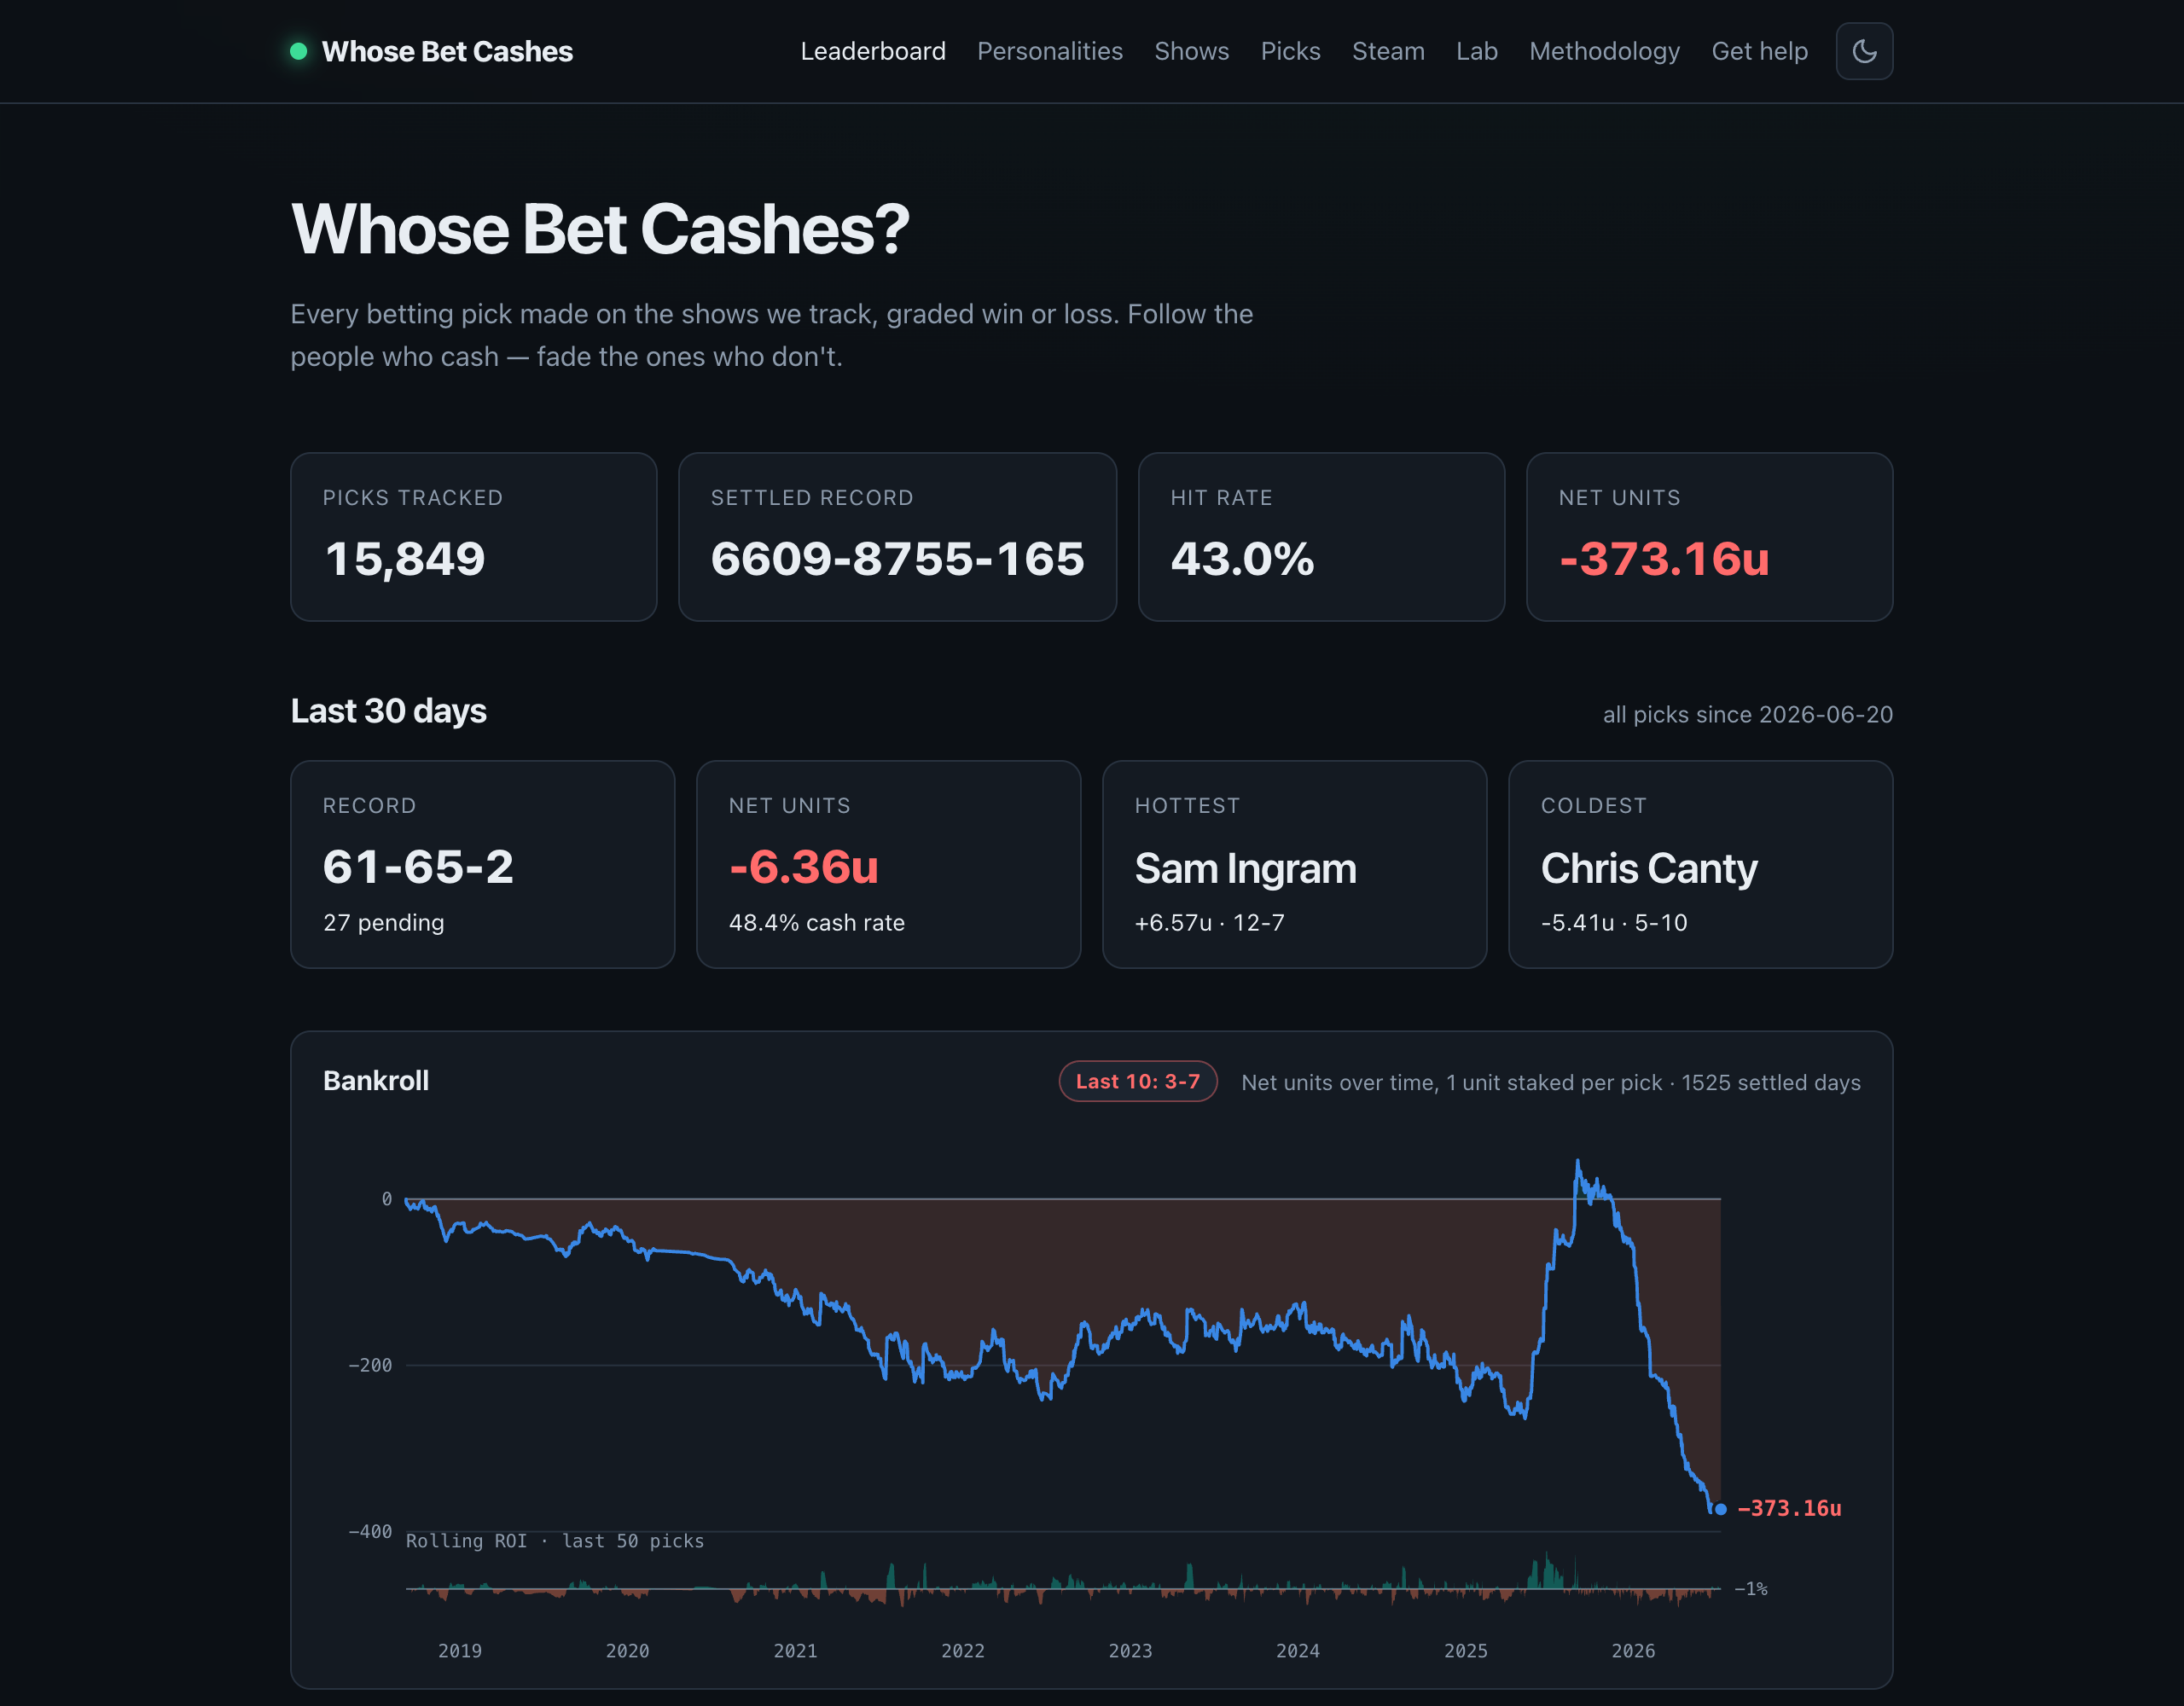
Astute readers might notice that the win-loss record of the betting quotes above is four wins and six losses. Let me tell you that's not by accident. In fact it's deliberately chosen to sit within a few points of the real rate, which is 43.02% across approximately 16,000 picks that survive our review bar, out of about 20,000 pick-shaped statements the pipeline extracted from various sports betting or talk podcasts. For those of you that gamble, you may say "Gunnari, win-loss percentages don't measure the true results of betting. One long shot cashing can pay for a pile of losing coin-flip bets." And you're correct. In third place on the units leaderboard is a golf analyst with a record of 2 wins and 19 losses. One of those wins was a plus-5000 Doug Ghim pick, so he sits comfortably in profit while cashing under 10% of the time.
Even with the occasional 50-1 hero, the hosts and guests across the betting corpus are down approximately 373 units collectively. How do I know this, you ask? I extracted the receipts, graded them, and published every last one of them.
How a sentence spoken on a podcast becomes a graded row in a database
Pick extraction and storage pipeline
Actually, surprise: there is no database! Instead, each episode is one JSON file in the repository. You might be asking yourself, why would you opt to do this instead of using a database? I'm glad you asked! For this particular project, using JSON and git as the system of record makes a lot of sense. Even though we didn't use an actual database for this project, by using Zod we still get schema enforcement. This happens because Zod parses every episode file at build time and a malformed pick fails the deploy instead of shipping an incorrect record. I don't need to build in any change data capture mechanism, as git has that by default via its history. On top of that the site is built statically, so there are no runtime queries, no need for transactions, etc. The downside to this is that in the future if we do want to have user queries on the site, we will need to completely rework our storage solution.
Now that you know how we store the picks, we need to explain how we extract a pick from a podcast and into JSON. There's an ingest pipeline that runs as a GitHub Action on a weekday cron. This action performs the following steps:
- Checks the RSS feeds of the shows we track
- Downloads the audio files and archives them in case we ever need to re-parse them
- Splits the audio into chunks using ffmpeg, since Groq has upload size limits, transcribes each chunk with Whisper via Groq, then stitches the transcripts back together using
mm:ssmarkers - Extracts any bets using Claude Sonnet, with a prompt that encodes the commitment rules (what counts as a pick), and finally returns JSON
- Retries if the previous step finds zero picks or only low-confidence ones, up to three attempts, re-downloading the episode each time because ads are inserted server side and land at different points on every fetch. The best attempt wins.
- Passes picks through a vetting gate. This does deterministic checks to verify that each quote actually exists verbatim in the transcript at the stated timestamp, that lines/odds appear in the spoken words, plus an independent second model pass that classifies whether the host actually made a committed bet. Leans, future intent, and listener advice get dropped before they're ever written.
- Opens a PR with a JSON file per episode plus the full transcript with every pick and its quote in the body for review
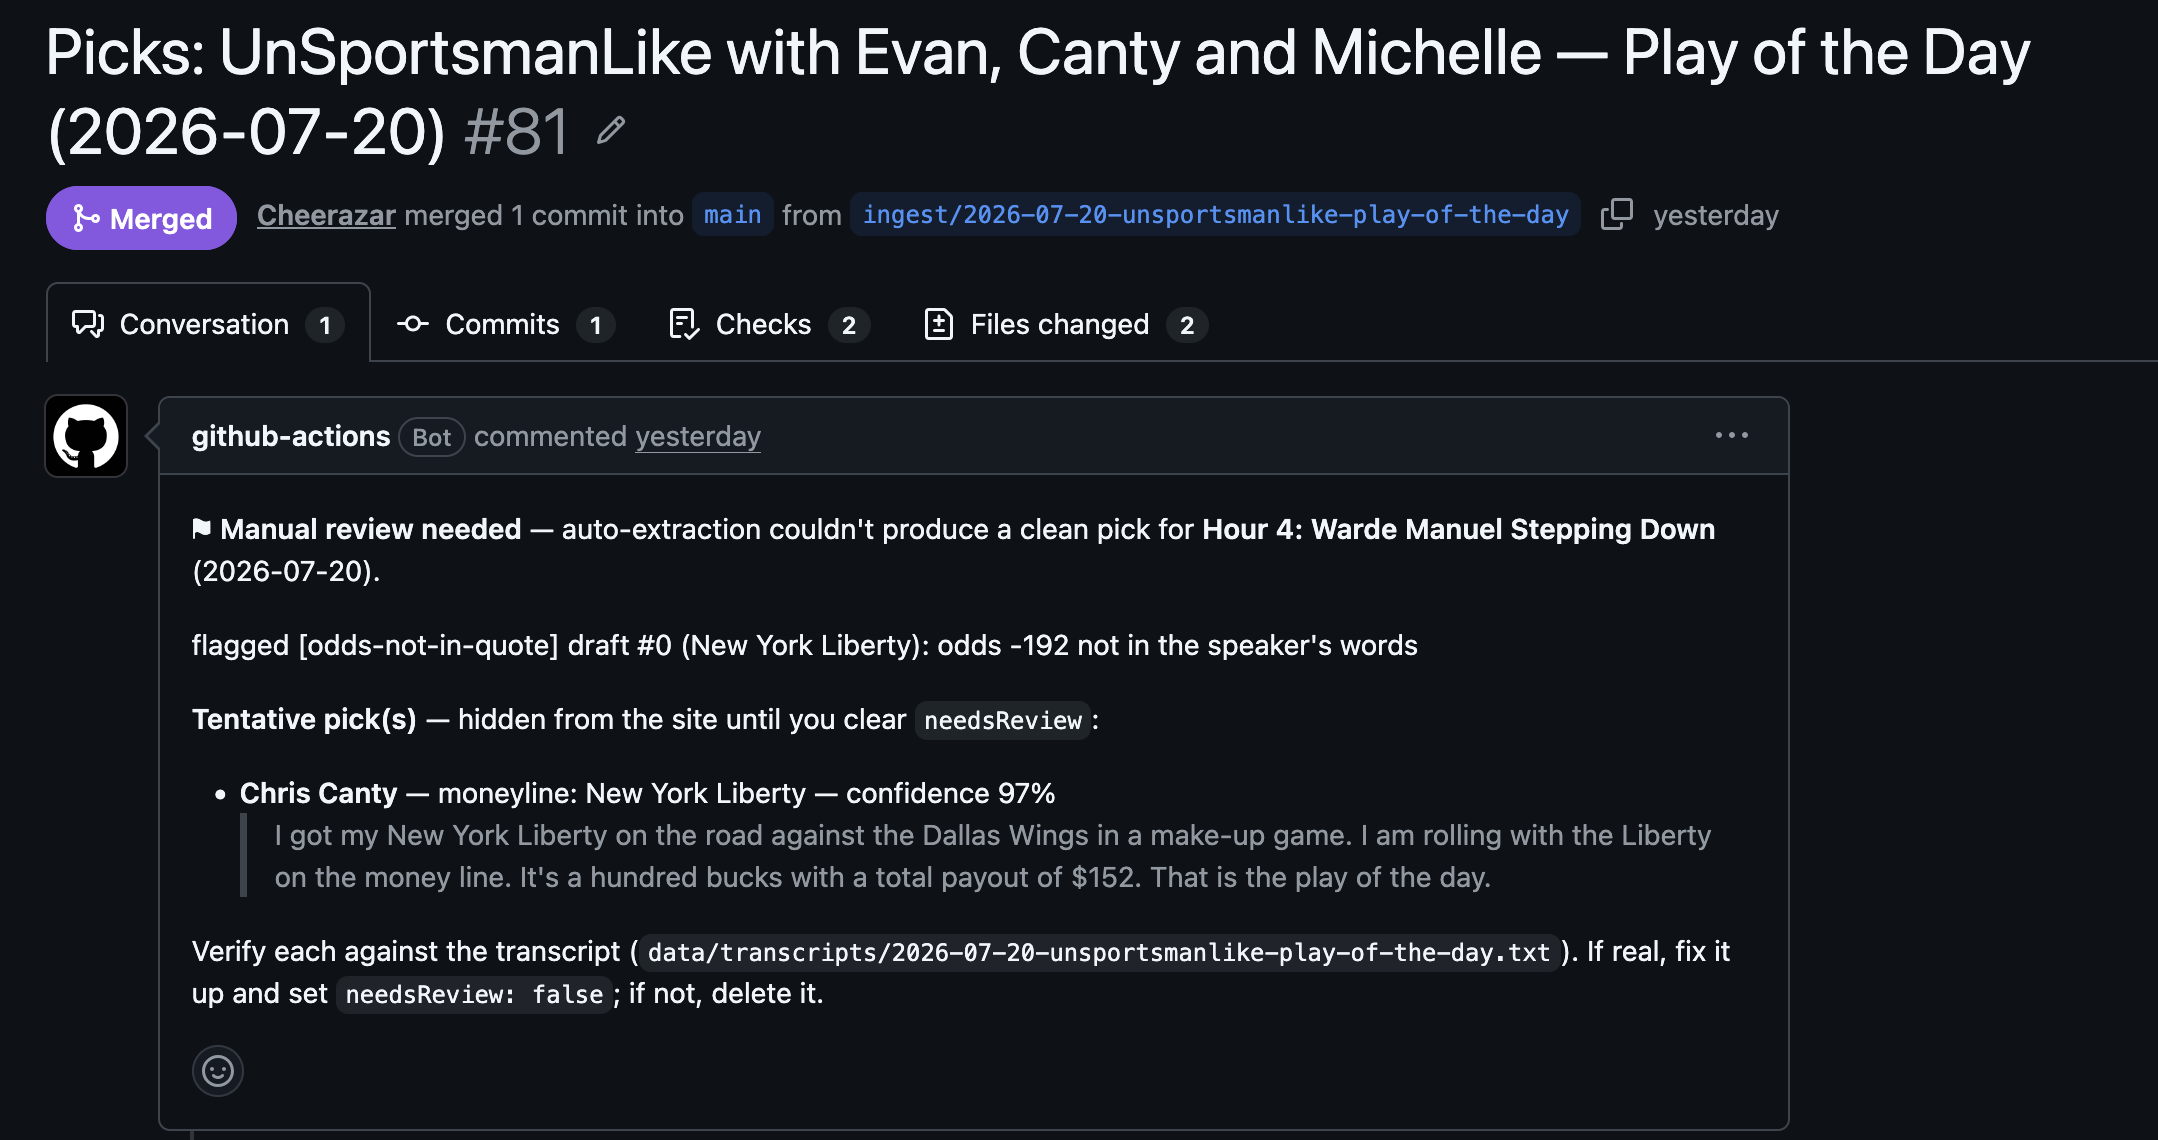
Following all of this, I review each PR to see if there's anything I need to address. If everything looks good, when I merge the PR, it triggers an automatic build and deploy. This results in the pending picks making it up to the website.

Bet settling and research pipelines
The extraction pipeline gets the picks up onto the website and then there are two additional pipelines that help us settle each bet to a win, loss, push, or void. Most picks can be handled by the daily settling pipeline, but any that can't be will be run through the weekly research pipeline. Let's dive into the settling pipeline first.
Settling pipeline
This runs as a GitHub Action on a daily cron around 8 or 9 a.m. Eastern depending on daylight saving. By having it at this time, all of the sporting events from the previous day will have completed and can thus be settled. Each pick gets a settleWindow property, which has the earliest and latest date that pick can settle. The settler will only attempt to resolve bets where the settle window has opened. That process does the following tasks:
- Finds the game/match/event on ESPN's public scoreboard API
- Grades that game using unit tested functions. These functions can handle:
- Spreads and totals
- Moneylines including soccer
- Player props
- Parlays
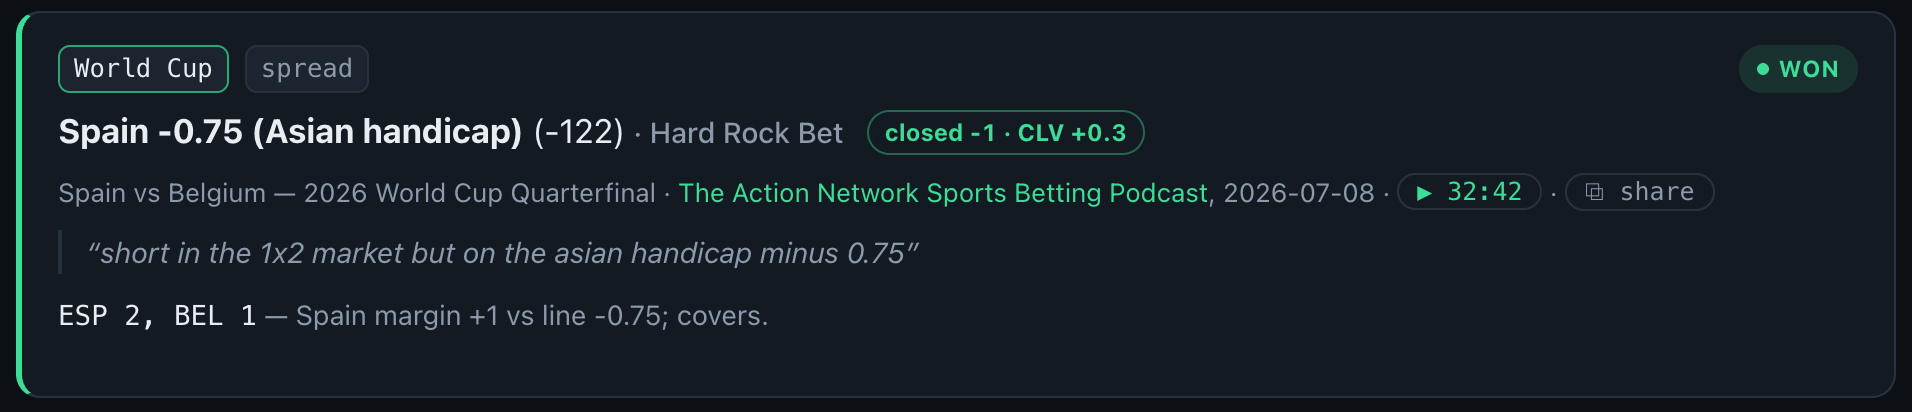
All of the graded picks get marked with a resolution, which is a human readable summary. It'll include the final score, stat line, or outcome. Any pick that can't be settled by the previous steps gets marked as "needs manual settle" and is called out in the PR description for my review. Picks that are marked as such get resolved in the final pipeline: the research pipeline.
Research pipeline
The research pipeline is used to resolve anything that can't be resolved by a box score. An example of this is "over 1.5 QBs drafted in round 1." Each pick like this goes to a Claude agent with server side web search enabled. This agent goes out and searches for whether the market has decided, and records its verdict through a forced structured-output tool. What this means is that the agent must return a structured output that matches the declared JSON schema. For example, fields like outcome (won/lost/push/void), summary, statLine, and a settleWindow with earliest and latest dates. We require this so we get machine-parseable data back instead of a paragraph of prose that would need its own extraction logic. The agent will also go out and determine the settle windows for futures. These settle windows are then used by the daily settling pipeline.
Both the daily settling pipeline and the research pipeline conclude by opening a PR that I then review. Sometimes the review is straightforward and I can simply hit merge. Occasionally I'll need to intervene and do a little research myself or I'll ask another Claude agent to do that instead to make a final determination of the pick status. In the end, each pick, no matter how it was settled, also gets marked with a source field such as espn, research, or manual. By having this, we can determine the provenance of how each pick was graded.
So who's actually sharp?
Now that I've explained how we go from podcast episode to extracted and graded pick, the next part is to discuss what can be learned from all of this. First we'll start by showing you my favorite chart on the site. Each bubble is an on-air personality, the x axis is how often they beat the close, and the y axis is whether they actually make money. The size of each bubble is how many of that personality's picks we captured a closing line for, so the bigger the bubble, the more you can trust where it sits. A small bubble in a great spot might just be a hot streak. The market respects the top right quadrant, luck lives in the top left. This is because the top right is where the personalities are sharp and profitable, while the top left is where they're profitable without beating the market.
One quick note on measurement before we look at the chart. Every "close" in these numbers is the consensus median across legal US books, which is the middle of the market rather than any one app's number. Books disagree with each other at close all the time, and grading everyone against a single book would bake that book's quirks into every stat on the site. When a host names a specific book on air we grade against that book's real quote, and for everything else the consensus is the ruler. Later in the post I'll show how I stress-tested this choice.
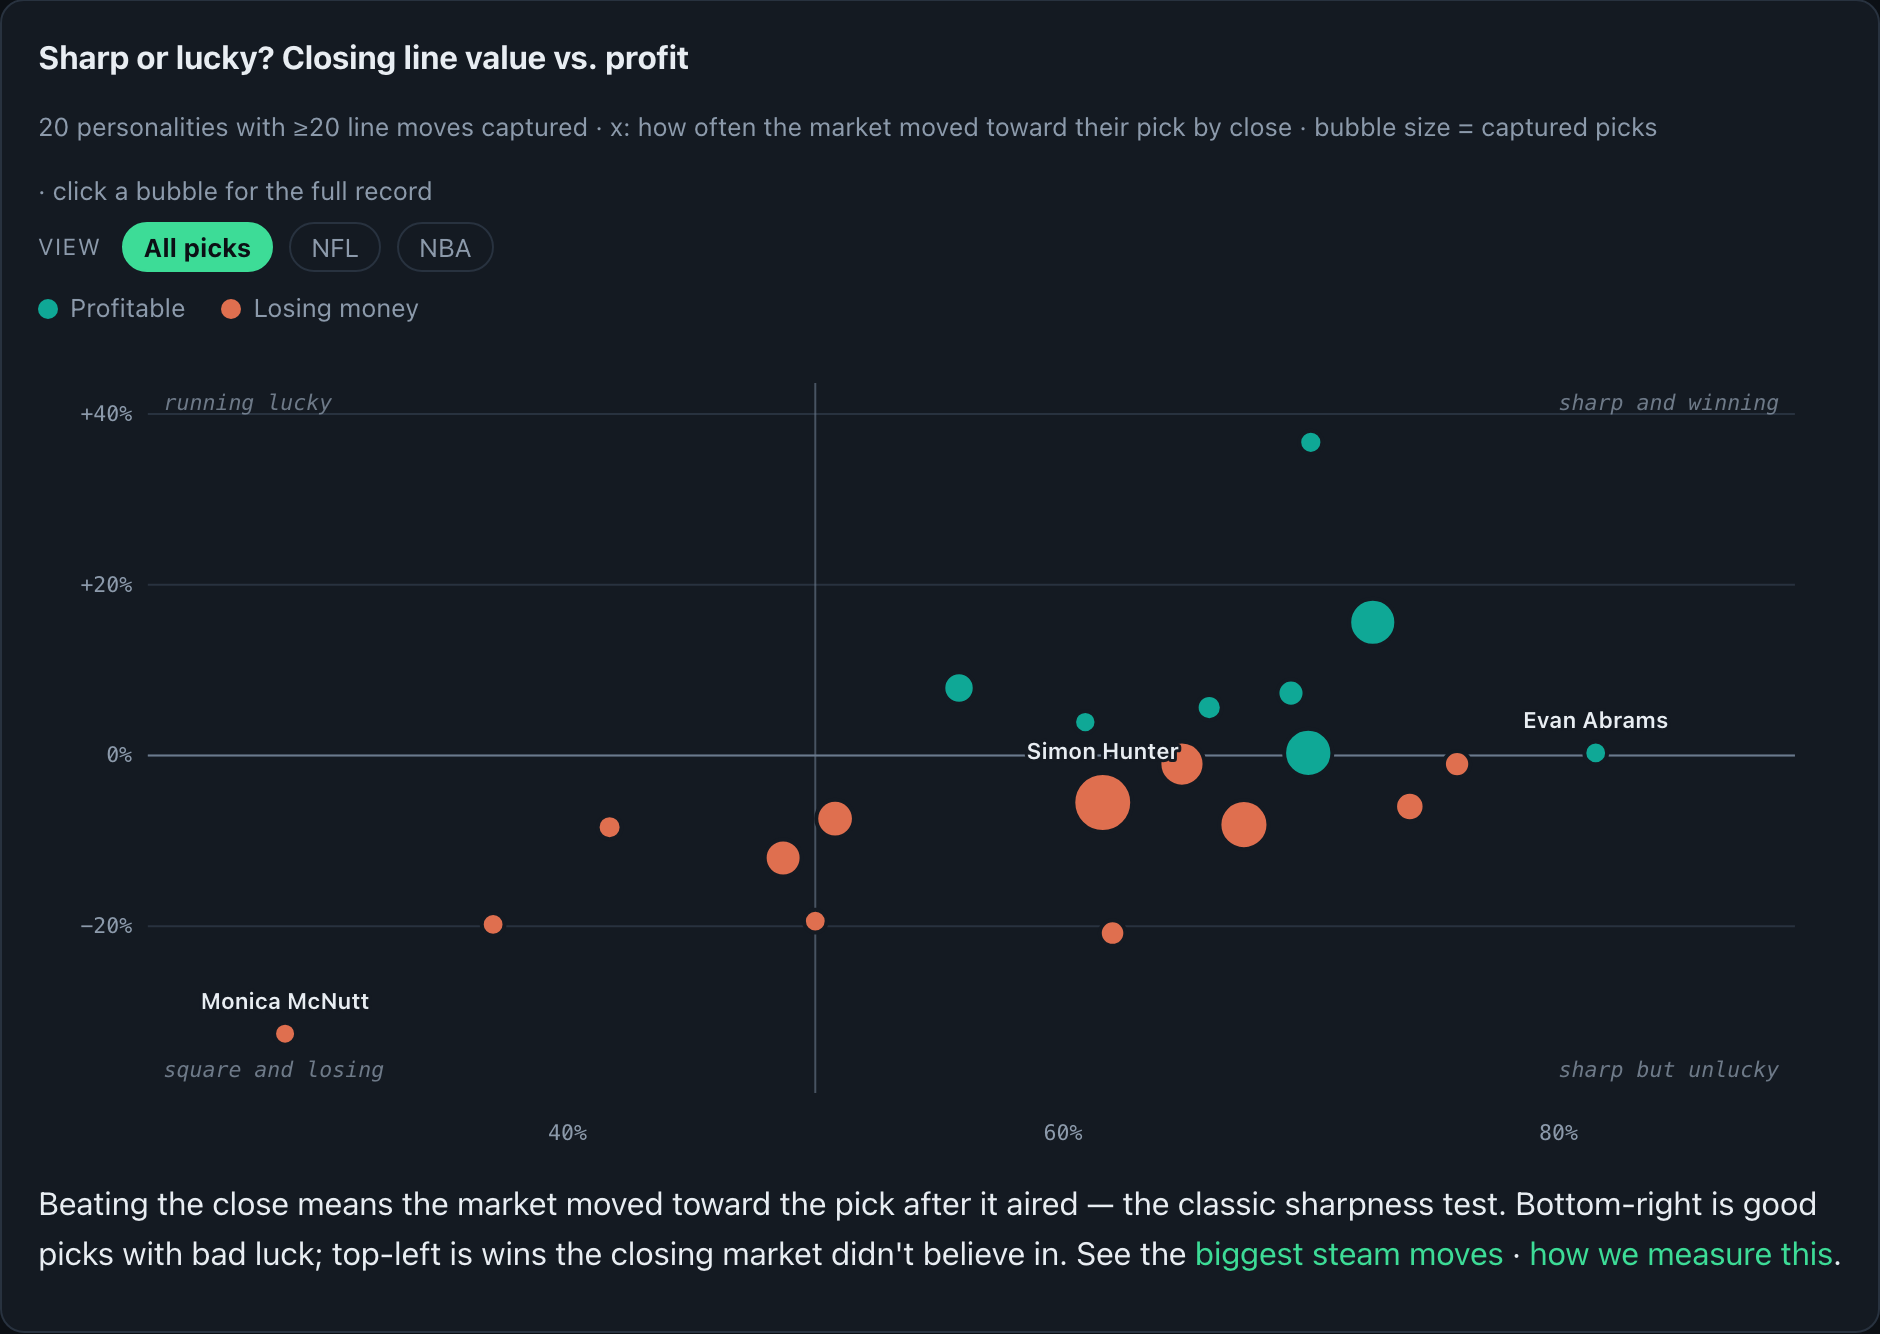
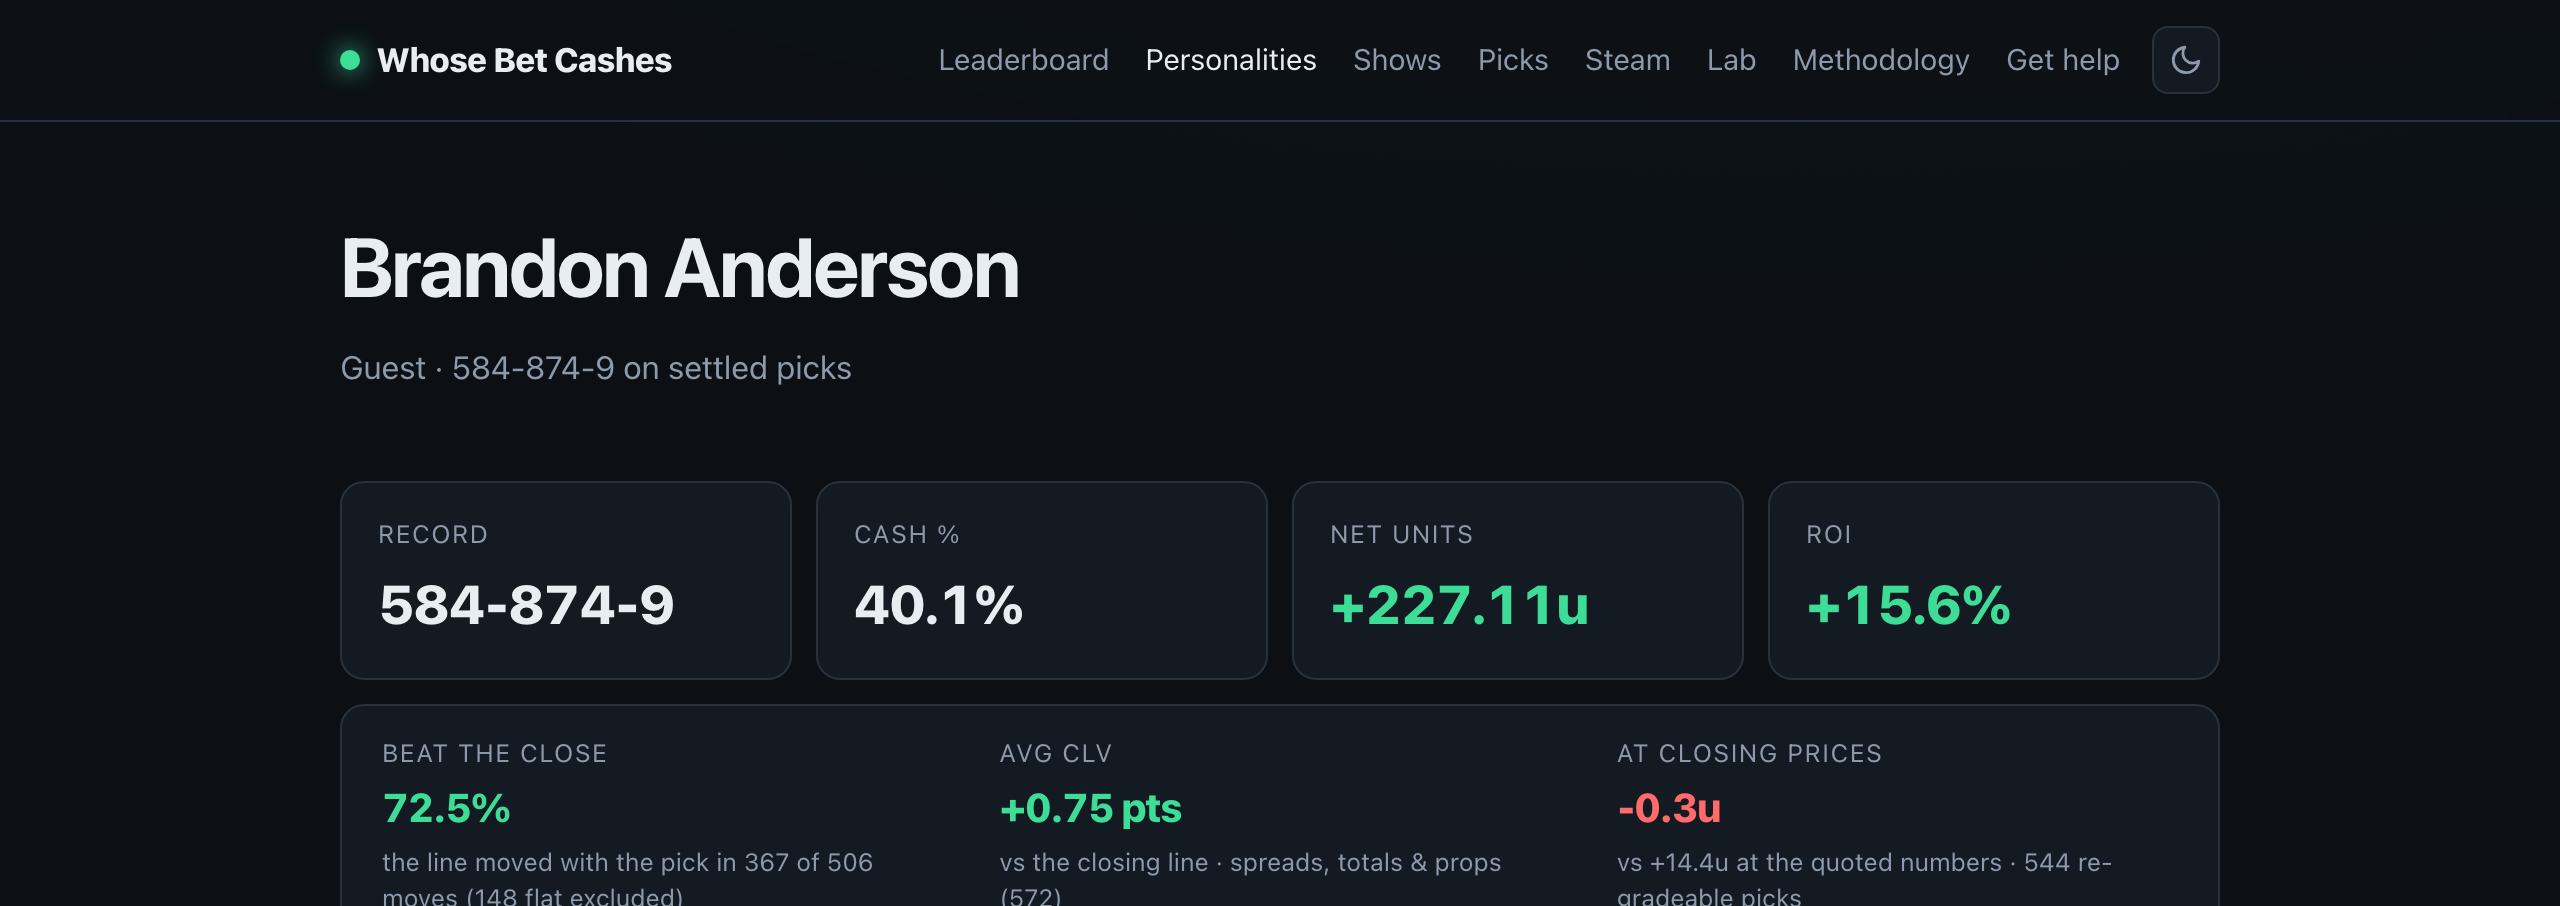
The standout on the chart is Brandon Anderson, who is a regular guest that only cashes 40.1% of his picks, but is up 227 units anyway, because he lives on long-odds futures and underdogs. The market moved toward his number on 367 of 506 picks where the line moved at all, a 72.5% rate, which is enormous 🤯. But the what-if math is the humbling part. This test only works on settled picks that can be cleanly re-graded at a captured closing price, which rules out the futures where most of his profit lives and leaves 544 picks. At the odds he quoted on air, those 544 are worth plus 14.4 units. Re-graded at closing prices, plus 14.4 becomes minus 0.3 🫠.
The reverse lesson also shows up clearly on the chart. Simon Hunter beats the close 61.6% of the time, which is a genuinely sharp rate, yet he is down 99.7 units. Beating the close proves you're getting good numbers on your picks. At the same time, the vig means a good number isn't automatically a profitable one. His edge is real, it's just smaller than the bookmaker's cut. Both things are true and the site shows both.
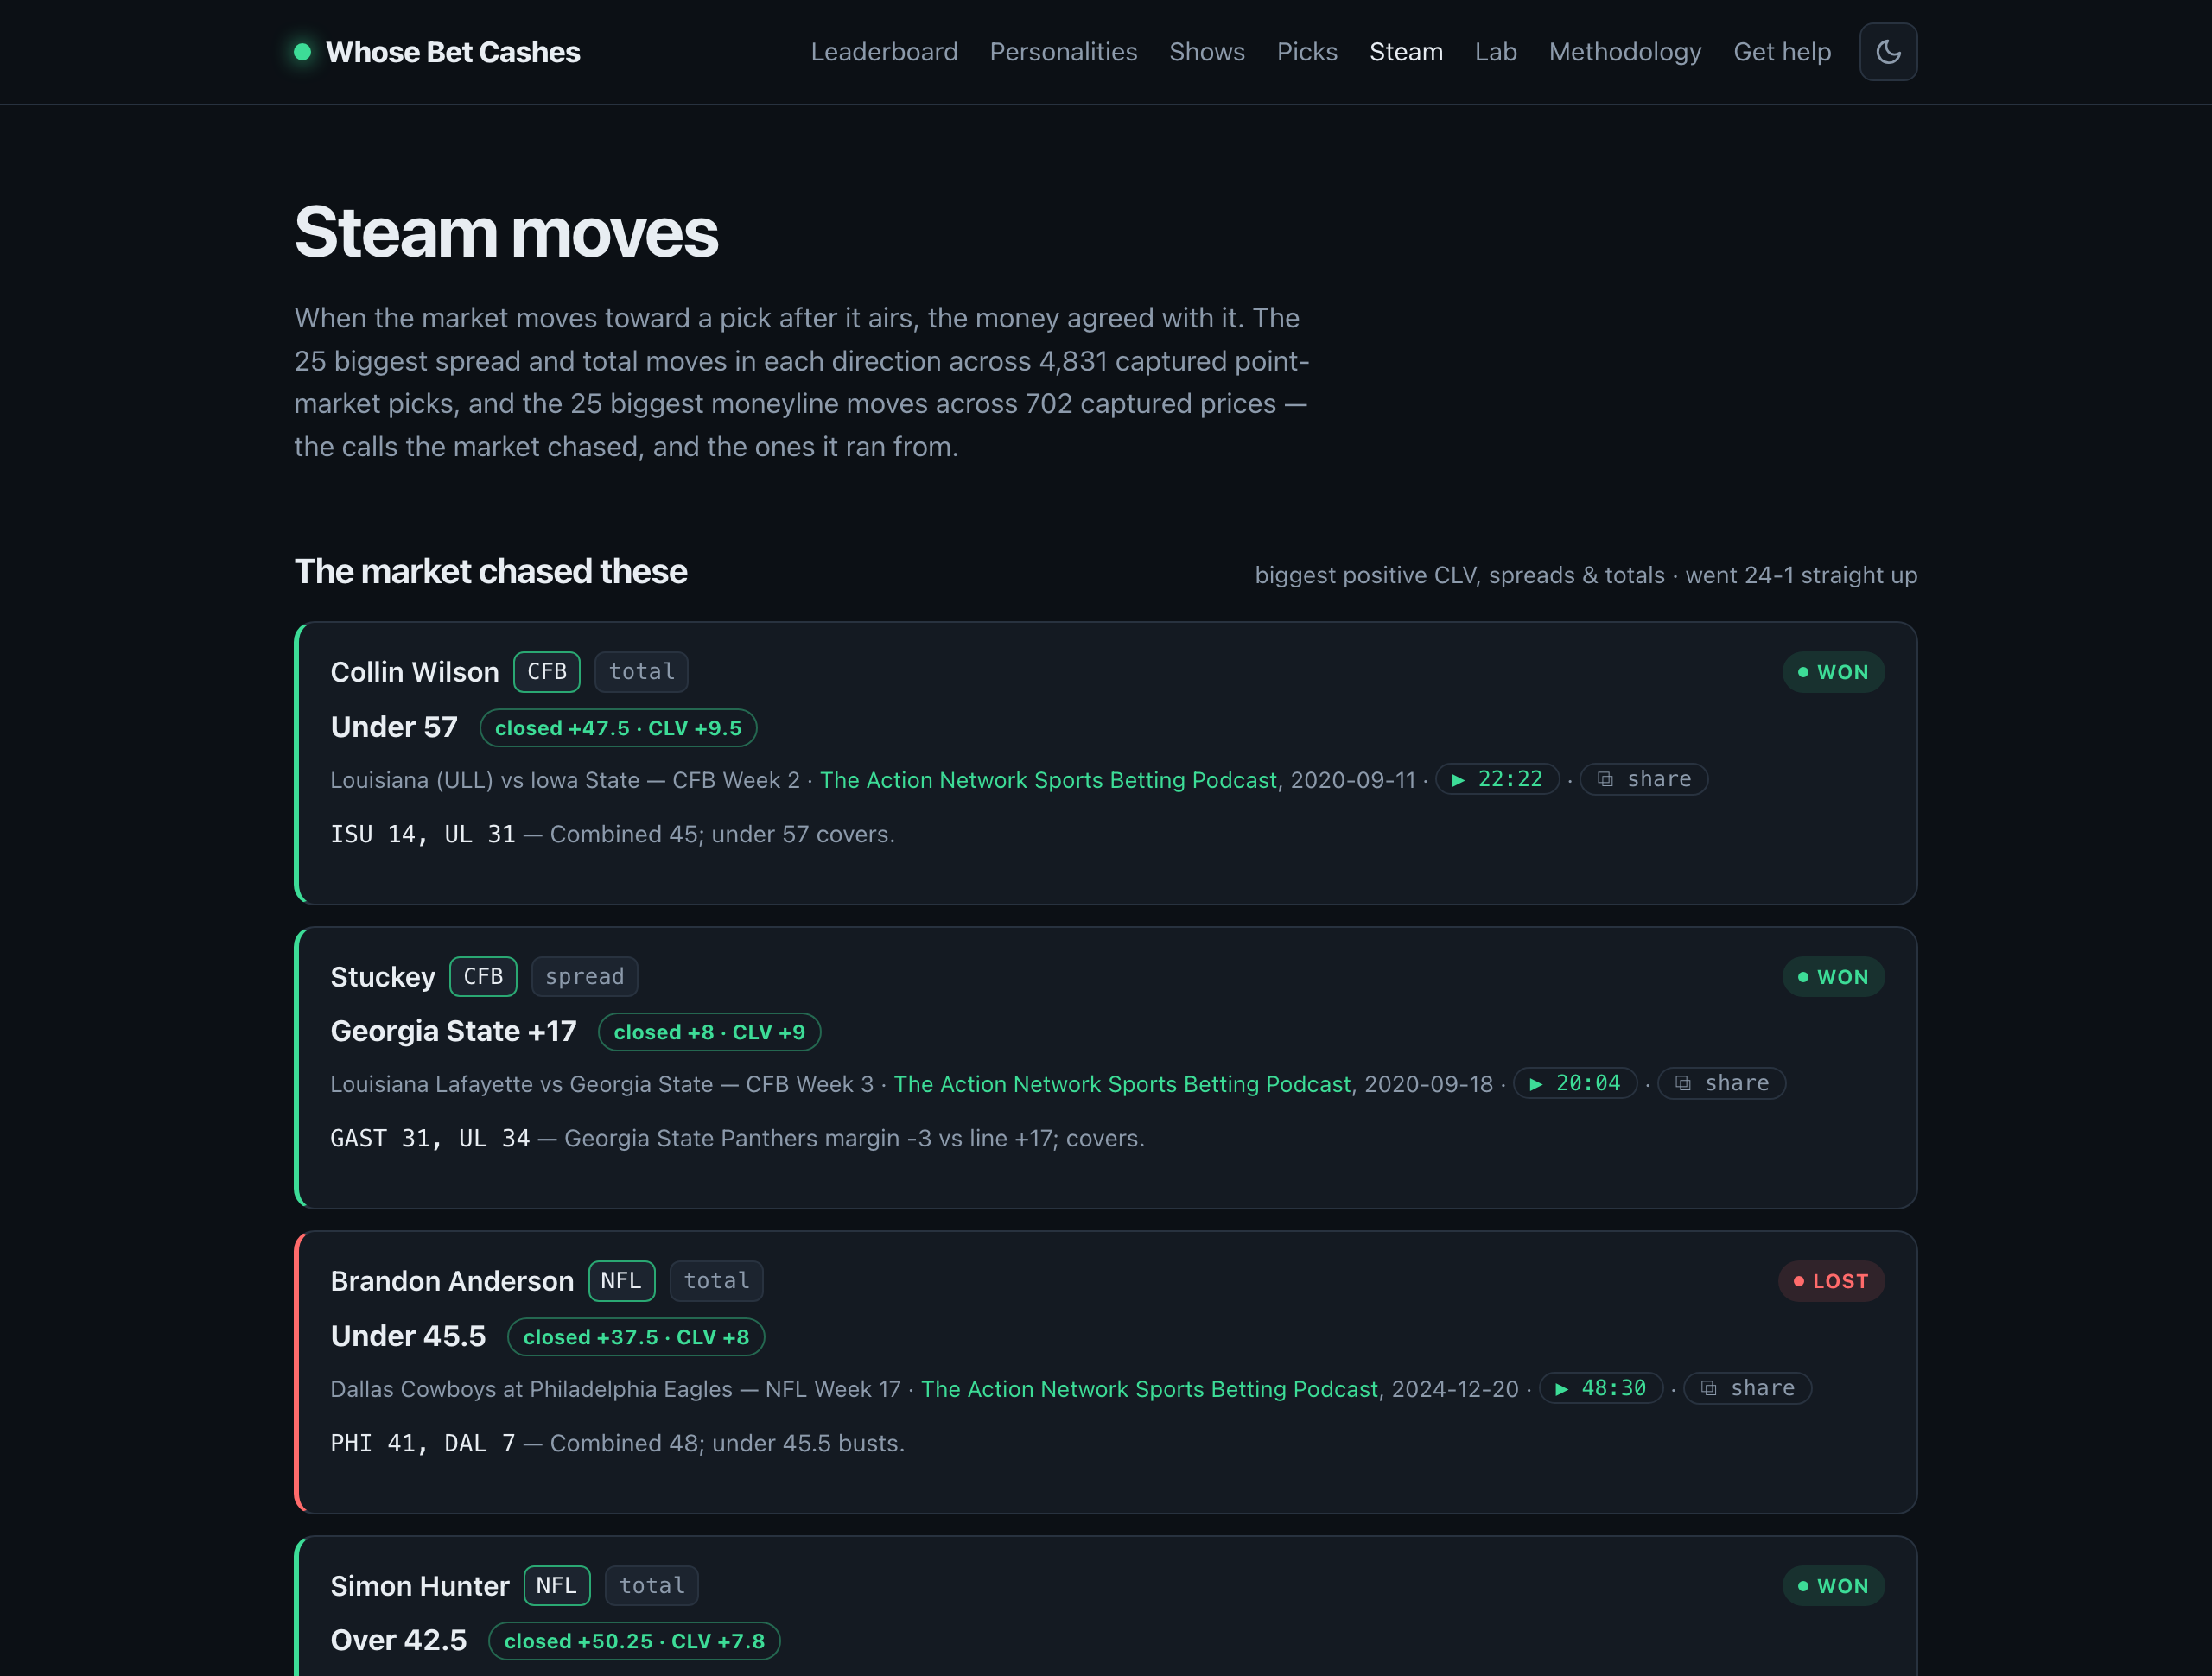
The steam page makes the whole idea visceral. Across roughly 4,800 captured spread and total picks, the 25 the market chased hardest went 24-1 straight up. The 25 the market ran away from went 6-18 straight up with one push. When the money disagrees with a pick, believe the money.
Auditing my own conclusions
Every beat-the-close number above is measured against a consensus median across legal US books, and that invites a fair objection, because nobody can actually bet a median. To address this, I created a Lab where I attack my own methodology with the cached line snapshot archive.
Remember the consensus median from earlier? Fantastic, let's dive in, as this is the crux of how everything on the site gets measured! The consensus median is how the site answers "where did the market close?" without picking a favorite sportsbook. At closing time we snapshot the same market at every legal US book our odds feed carries, take the median line across them, and then take the median price among the books sitting at that line. For example, if five books close the Chiefs at -3, -3, -3.5, -3.5, and -4, we sort them and take the middle one, which is -3.5. No averaging. The median only asks which number sits in the middle of the pack, so one book hanging a crazy line can't drag the yardstick anywhere. And when a host names an actual book on air, we grade against that book's real quote instead. The consensus is the fallback ruler, and the robustness study exists precisely to prove the conclusions don't depend on it.
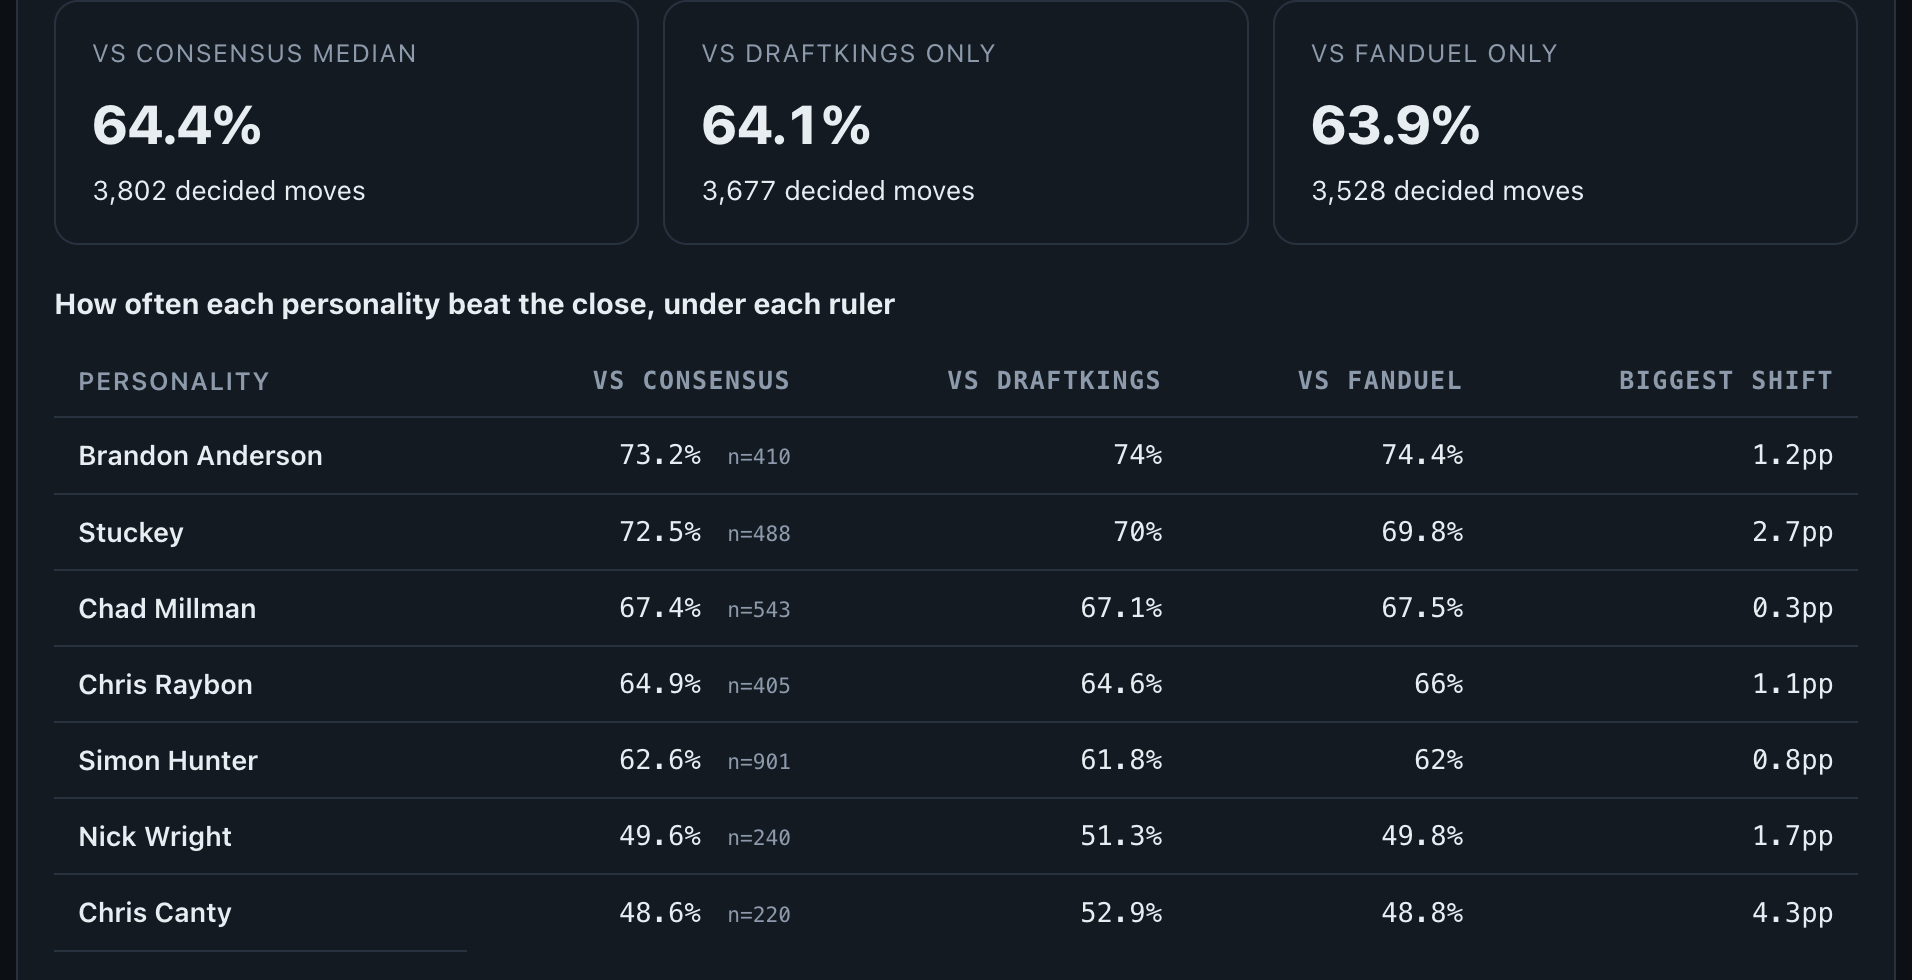
For the robustness study I re-graded the same 5,440 picks three times: against the consensus close, against DraftKings' closes only, and against FanDuel's closes only. The site-wide beat-the-close rate comes out at 64.4%, 64.1%, and 63.9% respectively, all within half a point of each other, and the only movement on the leaderboard is the two coin-flip rates at the bottom trading places. The numbers aren't a quirk of the consensus median. They hold up against real books.
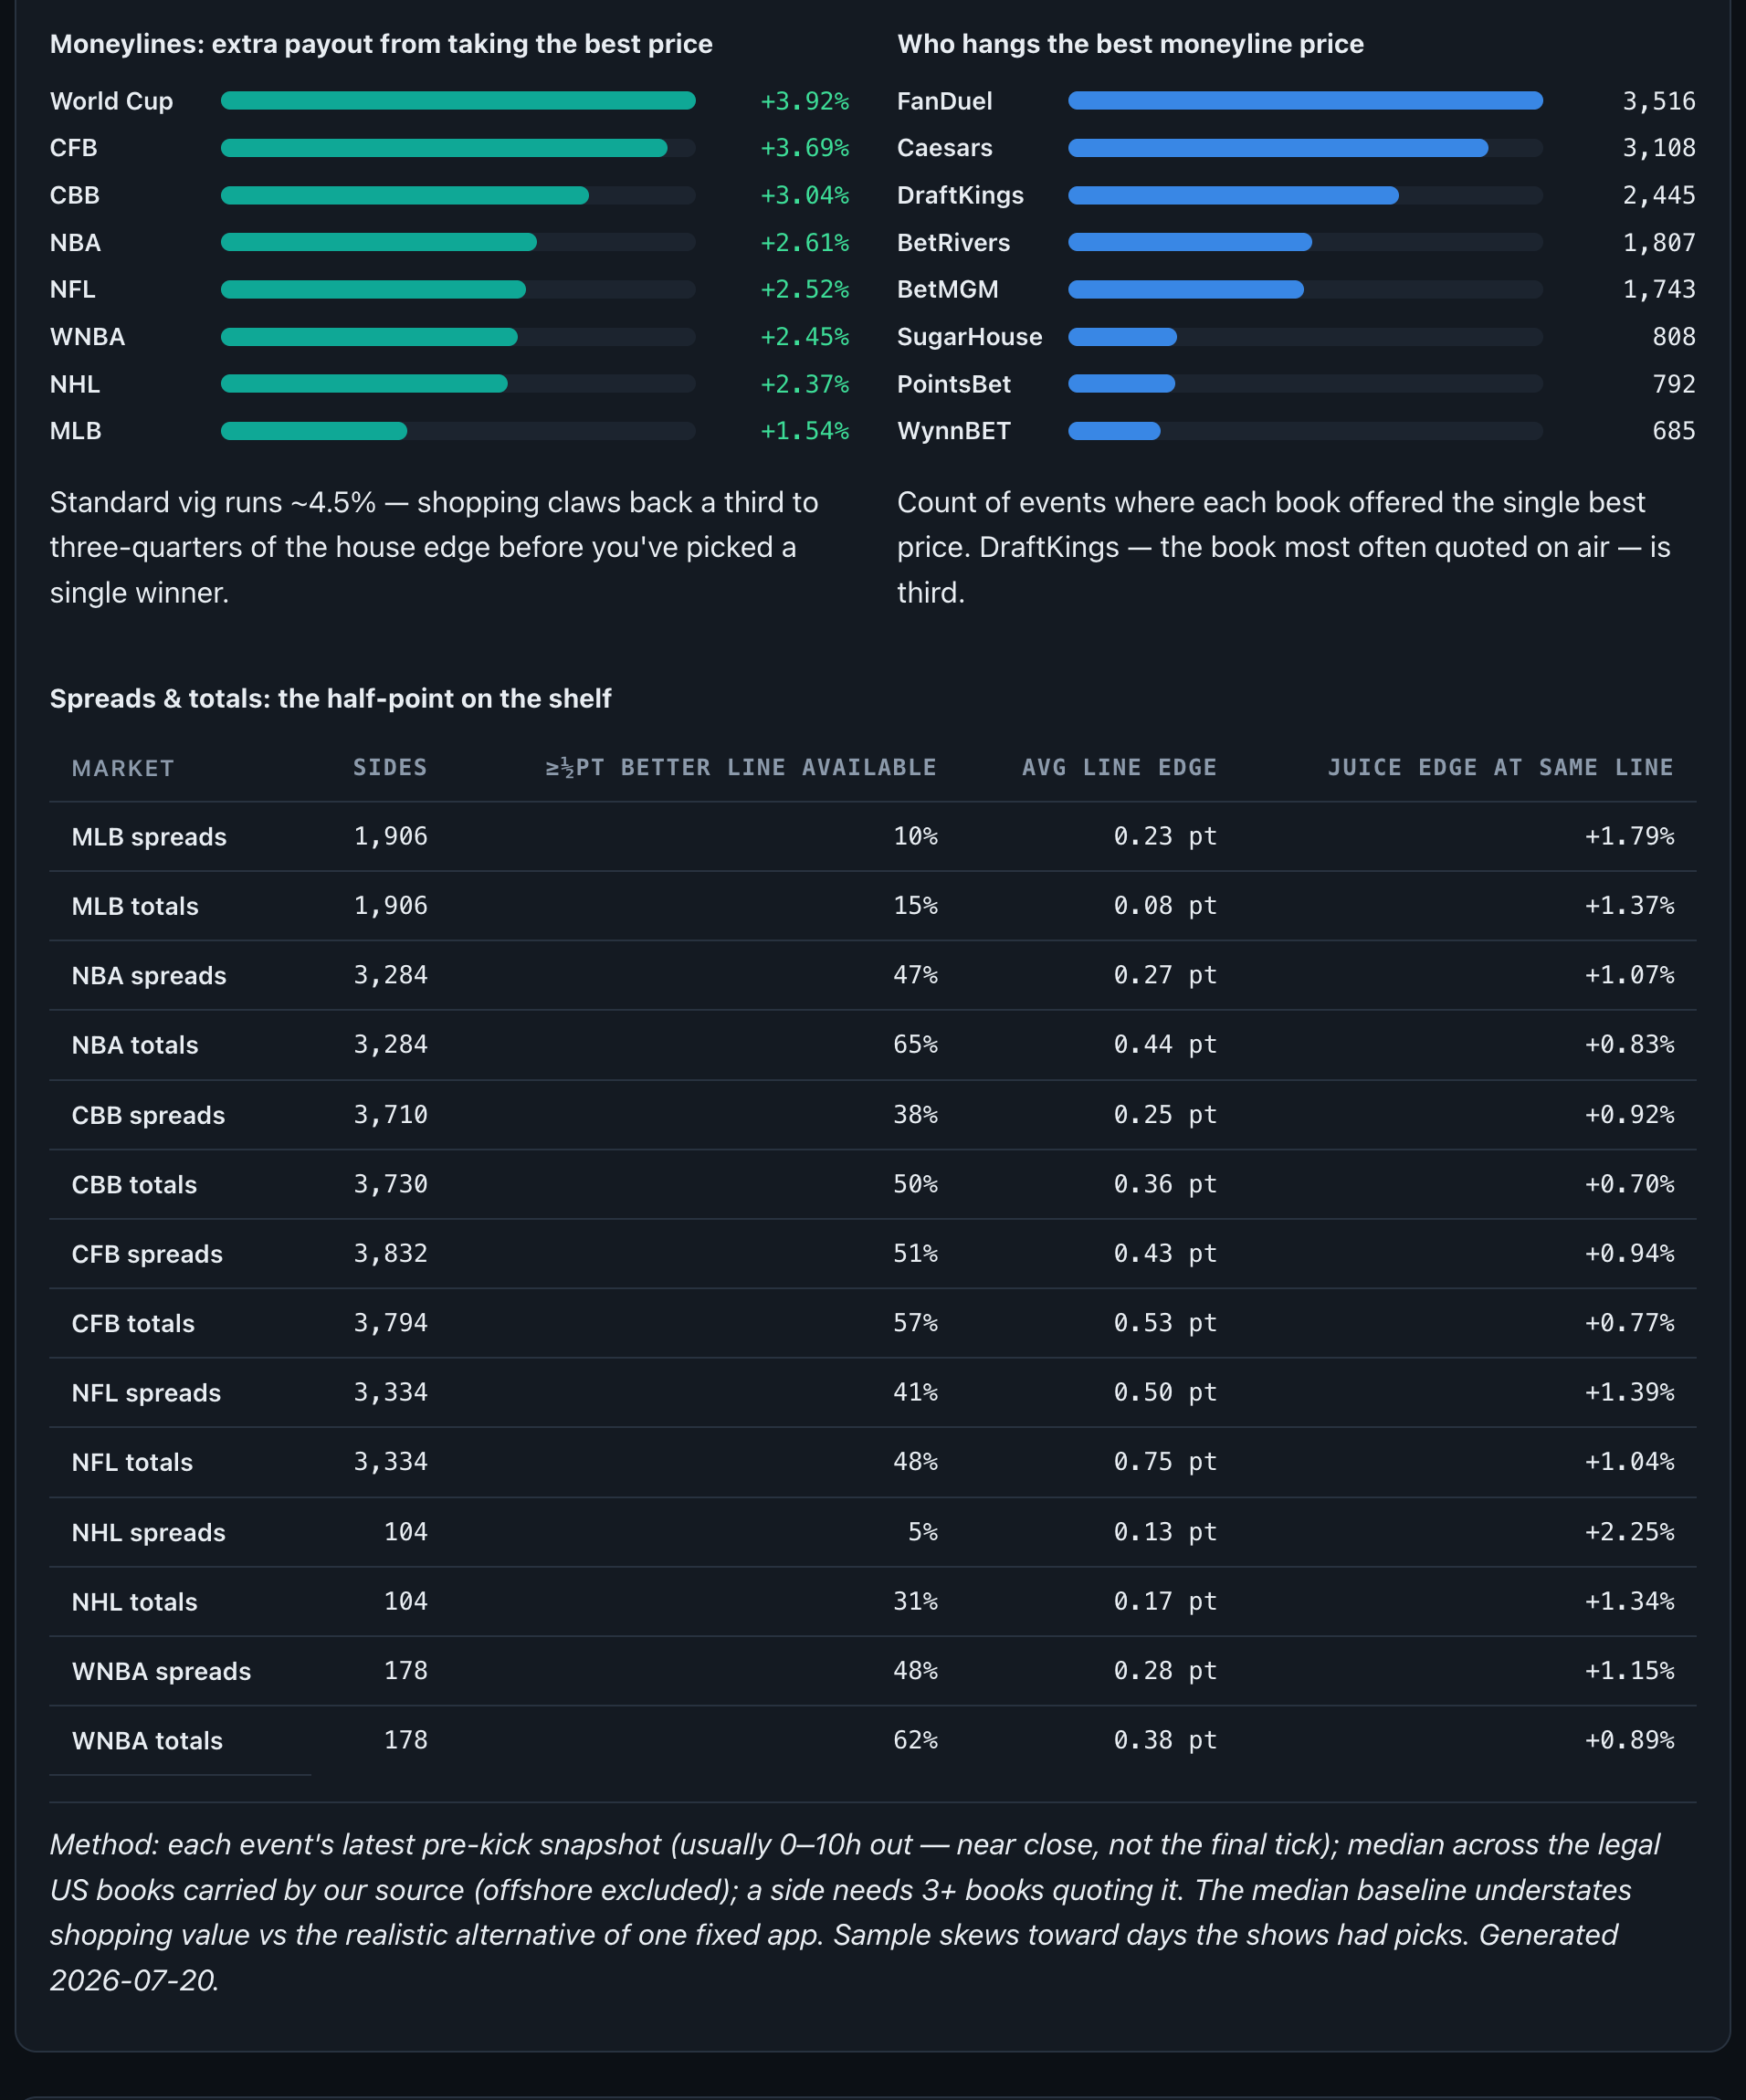
Two more studies fell out of the snapshot archive for free. The first is line shopping, which is checking what line each sportsbook is hanging on the same event and taking the best one. The archive let us measure whether that's actually worth the effort. It turns out line shopping is worth 1.5% to 3.9% of extra moneyline payout depending on the league, which is roughly the vig handed back to you for the extremely minimal effort of comparing five apps.
Here's what line shopping looks like in practice. Let's say it's Sunday morning and you want the Jets moneyline (I'm so sorry, Jets fans 😭). The median price across legal US books is +150, meaning a $100 bet wins $150. Our snapshots say that in the NFL, the best book on a given game pays about 2.5% more than that median. This means that somewhere out there an app is hanging roughly +154 on the exact same team in the exact same game. Same bet, same result, four extra dollars, and all you did was check another app.
Spreads and totals are where it gets even sillier, because the edge comes as points instead of pennies. On NBA totals, 65% of the sides in our archive had a line at some book at least half a point better than the median. On NFL totals the average gap between the median and the best available number was 0.75 points. Anyone who has lost an under by half a point knows exactly what that's worth.
And lastly, a control study confirmed the shows aren't just picking naturally volatile games, since picked games move about the same amount as unpicked games from the same slates, with one college football asterisk. That check matters because if the shows only picked games that were going to move anyway, beating the close would be selection bias instead of skill.
The house always wins...
I'll conclude with the number the site is really about. I've got sixteen thousand picks from professional talkers that add up to a 43.0% hit rate and minus 373 units. Given that, if this site convinces anyone of anything, I hope it's that the various picks segments are entertainment, and certainly not investment advice. Since this blog post and app contain lots of betting information, I made sure to include a help page with real resources linked from every footer.
Check it out at whosebetcashes.com. If your favorite host's page hurts to look at, I'm sorry. The numbers don't lie 😅