Debugging React Native and Redux with React Native Debugger
- react-native
- debugging
- redux
This was originally published on Medium on November 24, 2017.
Every developer will get to a point when they're working where they're going to have to debug their code. Sometimes figuring out how to do that can be a significant challenge, with this in mind I made a simple React Native project that uses React Native and Redux, such that you could see how to configure the React Native Debugger.
This repo is here to explain how to setup the React Native Debugger and Redux. After starting with the basic debugging option, Chrome Developer Tools, I ended up searching around for a better option and I ended up using React Native Debugger. This debugger has the full set of developer and debugging features that I was looking for, which included the Redux Developer Tools. Specifically you have access to the following:
- Your JavaScript code
- Chrome DevTools
- React DevTools
- Redux DevTools
As your developing a project each of these is worth its weight in gold and to have them wrapped up in to one neat little package is almost too good to be true!
Installing React Developer Tools and Setting Up the Repo
To get the example up and running with React Developer Tools, here are the basic steps to get started:
- Clone the repository to your machine
- Run
yarn installfrom the root of the project - Install React Native Debugger
- Open React Native Debugger (close any other React Native Chrome DevTools debugging windows you have open)
- Run
yarn iosto start the iOS simulator
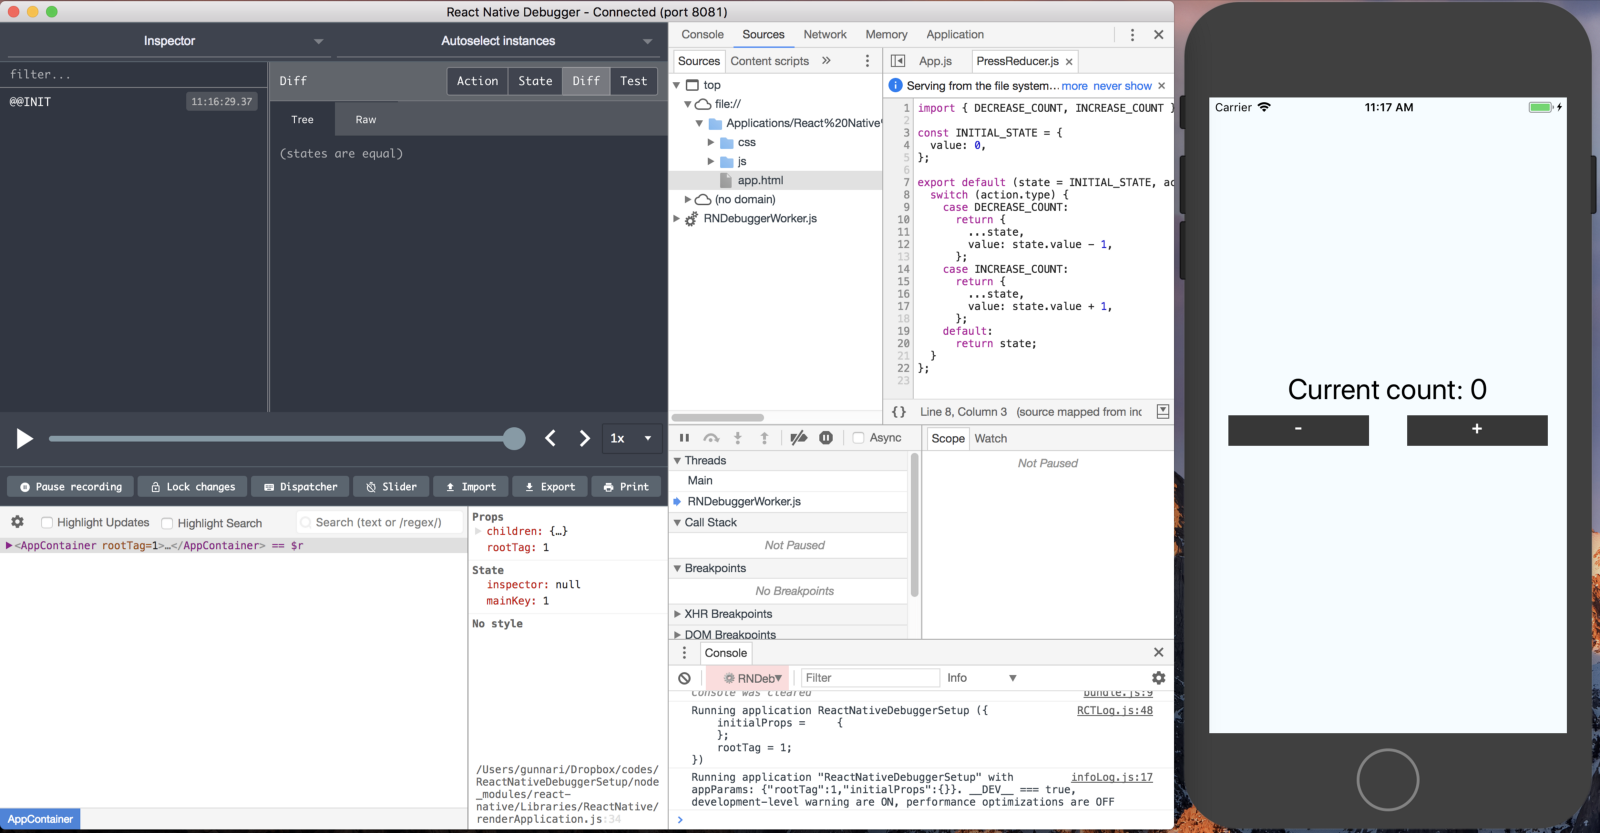
After that you should see something like this with the React Native Debugger and the iOS simulator running.
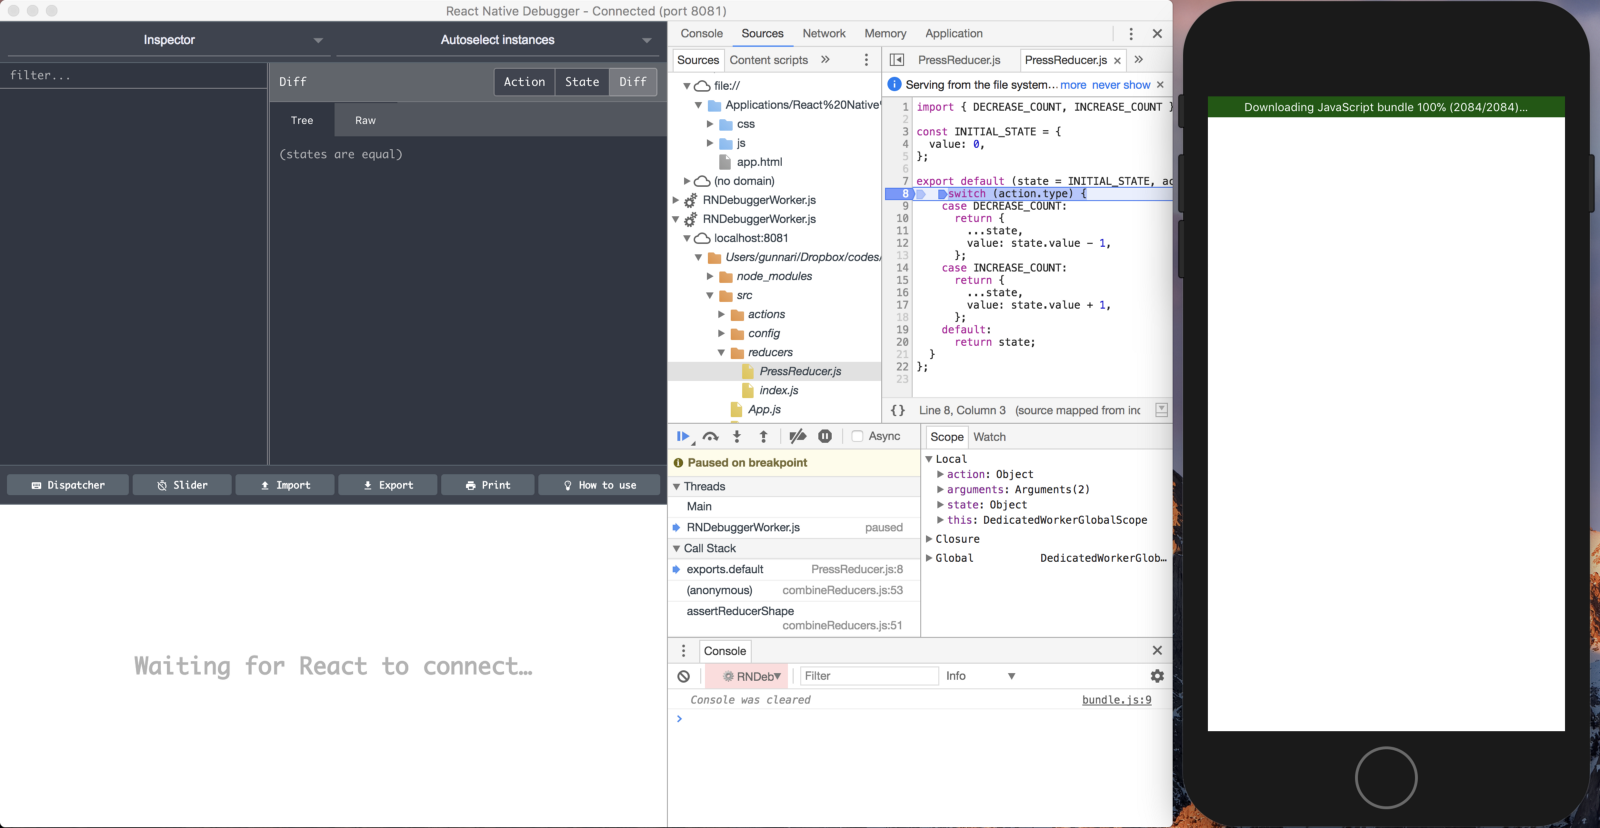
Now that you have the example running you can perform all of your standard debugging and inspection actions there. For example if you wanted to see what data was coming into the PressReducer, you could go to the "Sources" tab, open the PressReducer.js file, add a breakpoint to line 8, and then refresh the simulator by pressing CMD + r on a Mac. Voila you should hit your breakpoint and then be able to log things out in the console and mouse over certain variables!
Redux DevTools Configuration
The sample project is setup with the basic store configuration due to not using any middleware. If you wanted to use a piece of middleware like redux-thunk, you would need to modify src/config/store.js like so:
import { compose, createStore, applyMiddleware } from 'redux';
import thunk from 'redux-thunk';

import reducers from '../reducers';

const middleware = [thunk];
// eslint-disable-next-line no-underscore-dangle
const composeEnhancers =
  window.__REDUX_DEVTOOLS_EXTENSION_COMPOSE__ ||
  compose;

export default createStore(
  reducers,
  composeEnhancers(applyMiddleware(...middleware))
);
React Native Debugger exposes the following pieces of the redux-devtools-extension API globally:
window.__REDUX_DEVTOOLS_EXTENSION__window.__REDUX_DEVTOOLS_EXTENSION_COMPOSE__window.__REDUX_DEVTOOLS_EXTENSION__.connect
This is why this version uses the global __REDUX_DEVTOOLS_EXTENSION_COMPOSE__ and only falls back to the redux compose if that's not available.
Using Debugger Statements
With this setup, if you have Prettier fix your code upon save, you'll need to add debugger statements with an additional comment to disable ESLint, so they don't get cleaned out. You can accomplish this by adding the following code where you want to add a debugger statement.
// eslint-disable-next-line no-debugger
debugger;
This will prevent ESLint from reporting the debugger statement as an error and then having Prettier clean it up during save if you have that configured.
Wrap Up
After reading this and playing around with the repository, you should:
- Know how to use React Native Debugger in your project
- Be able to configure your project to use the Redux DevTools in React Native Debugger
As a developer, having a quality debugging environment can lead you to be more productive, while helping you track down pesky bugs and creating new and amazing features!